Track 4: "PDR for warehouse picking (off-site)"
Challenge Goal
Results
Prize
The winner of Track 4 will be awarded one of the following prizes by PDR benchmark standardization committee (JP) according to the winner's preference.
1) PDR module (Sugihara SEI Co. &Lt., 200,000 JPY worth) + 100,000 JPY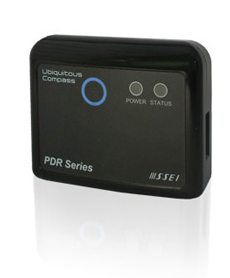
or
2) 150,000 JPYMain feature of the challenge
Off-site challenge approach
Multiple sources of information
Continuous motion and recording process
- Walking in a warehouse
- Vouching
- Picking at shelves (including the operating the terminals)
- Carrying goods using carts
Realistic walking style
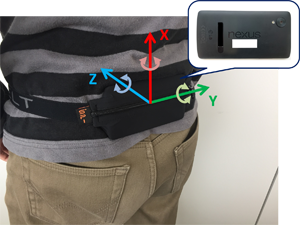
Phone holding
Desired localization approaches
- PDR method which has robust positioning functions for moving in a warehouse
- Functions to cancel out accumulated errors by given discrete positional refeference and RSSI of BLE beacons
- Time series optimization using the given data
- Keeping naturality of attitude during the picking action (picking position, amount of moving)
- Keeping naturality of walking speed
- Function to avoid incursion into the area of objections
Warehouse
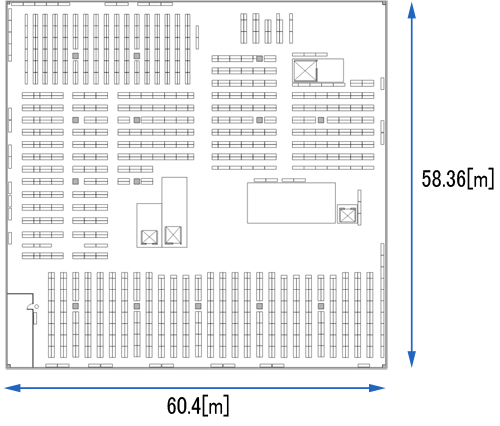
Logistics warehouse A
Click the image to see the enlarged image
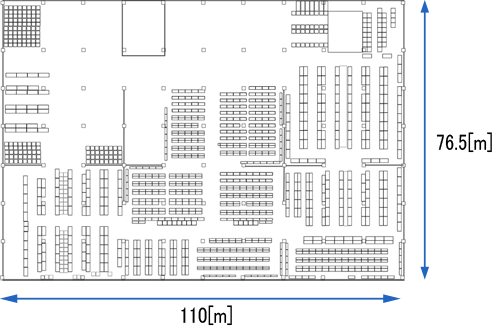
Logistics warehouse B
Click the image to see the enlarged image
Description of Datasets
Description of Competition data
Warehouse B is data to be used in the real competition, and sample data of Warehouse B extra only 30 minutes from the measurement start time.
The time (in Unixtime) of the range of the measurement in Warehouse B of this competition is as follows.
Terminal_ID,Measurement_start_time,Wearing_start_time,Measurement_end_time
2,1485239148,1485240513,1485248722
3,1485239234,1485240524,1485252460
4,1485239243,1485240545,1485252313
5,1485239286,1485240550,1485252407
6,1485239291,1485240555,1485252344
7,1485239328,1485240562,1485252227
8,1485239334,1485240568,1485252085
"Terminal_ID" is a number for distinguishing terminals. "Measurement_start_time" is the time when the terminal started recording sensor data. "Wearing_start_time" is the time when the terminal was actually worn on the employee's body. Before the workers worn the terminals, the terminals were arranged on a table. "Measurement_end_time" is the time when the terminal stop recording at the measurement.
Actual evaluation points for real competition are existed between wearing_start_time and measurement_end_time.
We are disclosing the data which is extracted only first 30 minutes of warehouse B as sample data. Data extraction was performed on "Sensor data of terminal(Working data)" and "WMS". Note that sample WMS data include WMS logs before Measurement_start_time, you can ignore the data outside of the range of measurement.
Dataset list for logistics warehouse A
Sensor data of terminal
- Sensor data when the terminal is placed on a stationary flat surface (.txt)
- Format
- Unixtime, Angular velocity (xyz), Acceleration (xyz), Magnetism (xyz), Gyro temperature(xyz), Temperature, Atmospheric pressure, ⊿t
- Sensor data when writing a figure 8 in the air with the terminal in hand (.txt)
- Format
- Unixtime, Angular velocity (xyz), Acceleration (xyz), Magnetism (xyz), Gyro temperature(xyz), Temperature, Atmospheric pressure, ⊿t
- Sensor data when picking with the terminal attached (.txt)
- Format
- Unixtime, Angular velocity (xyz), Acceleration (xyz), Magnetism (xyz), Gyro temperature(xyz), Temperature, Atmospheric pressure, ⊿t
Map information
- Map image (.png)
- Map size (.csv)
- Format
- The coordinates of the four corners of the map and the coordinates at the start (xyz)
- Shelf arrangement (.csv)
- Format
- Shelf number, Arrangement coordinates (xyz), Width, Depth, Direction to pick
WMS data
- Picking operation (.csv)
- Format
- Worker number, Time picked, Shelf number, Number of picks
Dataset list for logistics warehouse B
Sensor data of terminal
- Sensor data when the terminal is placed on a stationary flat surface (.txt)
- Format
- Unixtime, Angular velocity (xyz), Acceleration (xyz), Magnetism (xyz), Gyro temperature(xyz), Temperature, Atmospheric pressure, ⊿t
- Sensor data when writing a figure 8 in the air with the terminal in hand (.txt)
- Format
- Unixtime, Angular velocity (xyz), Acceleration (xyz), Magnetism (xyz), Gyro temperature(xyz), Temperature, Atmospheric pressure, ⊿t
- Sensor data when picking with the terminal attached (.txt)
- Format
- Unixtime, Angular velocity (xyz), Acceleration (xyz), Magnetism (xyz), Gyro temperature(xyz), Temperature, Atmospheric pressure, ⊿t, BLE reception information
Map information
- Map image (.png)
- Map size (.csv)
- Format
- The coordinates of the four corners of the map and the coordinates at the start (xyz)
- Shelf arrangement (.csv)
- Format
- Shelf number, Arrangement coordinates (xyz), Width, Depth, Direction to pick
WMS data
- Picking operation (.csv)
- Format
- Worker number, Time picked, Shelf number, Number of picks
BLE beacon information
- BLE beacon information
- Format
- MAC address, Installation coordinates (xyz)
How to participate?
Competitors are requested to follow the steps as mentioned below for participating this challenge.
Step1 Request for admission
For this track 4, admission process can be separated into pre-admission, and real-admission.
If you have an interest for joining PDR challenge, please send an e-mail to pdr-warehouse2017@aist.go.jp with your self-introduction (at least with your name and institution). Then we will provide the access pass (ID and Password) for downloading sample data. We regard this e-mail as your pre-admission for track 4.
Real-registration follows the same Admission Process with the other tracks.
[Admission Process]
A "competitor" can be any individual or group of individuals working as a single team, associated to a single or a number of organizations, who wants to participate in one or several tracks.
Competitors apply for admission to the competition tracks by providing a short (2 to 4 pages) "technical description" of their localization system, including a description of the algorithms and protocols used. The technical description must be sent by e-mail to the chairs of the intended track. Track chairs will accept or refuse the application in a short time, based on technical feasibility and logistic constraints.
After acceptance of the competitor's technical description, one member of the competing team is required to register to the IPIN conference, specifying that the registration is linked to a competition track. Full registration to the conference covers participation in the competition process (allocated time, support and space) and the submission of a paper describing the system.
Competitors are required to make an oral presentation of their system during a dedicated session at the IPIN conference. Additionally, competitor teams are invited, but not required, to submit a paper to the conference. The paper will follow the same peer review and publishing process as all the other papers submitted to IPIN. If the paper is work-in-progress, competitors can benefit from relaxed deadline as specified below.
Competitors who wish to test their system, but do not want to be included in the public rankings and compared with other competitors, can ask for that special condition in advance to the chairs of the relevant track.
Step2 Downloading sample data
Step3 Registration of IPIN conference
If you decide to join the track 4, you are required to complete real-admission. In order to complete real-admission, you need to submit a short (2 to 4 pages) "technical description" of their localization system, including a description of the algorithms and protocols used. And you (at least one member from your group) are also required to register to the IPIN conference.
Sample data provided for whom they completed pre-admission are not the final data for the competition. Actual test data and participation rights for the competition are exclusively provided for competitors who completed also completed the conference registration of the IPIN2017.
Step4 Access to the test data for final evaluation
Actual data for the competition are provided after confirmation of the completion of the conference registration. The competitors can obtain another user ID and a password for downloading the actual data for the competition.
Step5 Result submission
Competitors should submit their result of estimation of the trajectory with predetermined format which includes x,y coordinate of the target positions and orientation of the targets with timestamps. Definition of exact format and sample data for submission will be included in the actual data package described above.
Dead-line for result submission: 8 September 2017
Step6 Oral presentation of results at IPIN Conference
Competitors are required to present their methods and algorithms, and state their advantages of the methods and algorithms in the light of the evaluation criteria in the special session of the competitions during the conference. Additionally, competitors are invited, but not required, to submit a paper to the conference. At the end of the session, the competition organizers will show competitors' results and estimated trajectories. The results will be scored by a composite indicator according to the evaluation criteria.
Evaluation metrics
Evaluation index
- Integrated positioning error evaluation (Ed) Score 0~100
- PDR error evaluation (Es) Score 0~100
- Picking work evaluation (Ep) Score 0~100
- Human moving velocity evaluation (Ev) Score 0~100
- Obstacle interference evaluation (Eo) Score 0~100
- Update frequency evaluation (Ef) Score 0~100
- Comprehensive evaluation (C.E.)
Score 0~100
Note: The WMS provided as test data is a combination of two data. First is WMS of sample data (picking data for 30 minutes from the beginning). Second is WMS of true position decimated (picking data after 30 minutes).
The section to be evaluated is unified to the estimated trajectory excluding the sample data time.
Integrated positioning error evaluation (Ed)
Evaluation method: The score is calculated from the median of all position errors (Fig.2).

Fig1. Relationship between estimated trajectory and true position

Fig2. Ed score as function of the median of position error
PDR error evaluation (Es)
Evaluation method : The regression line of the position error is calculated based on the elapsed time from the correction position (Fig.3). The score is calculated based on the slope of this regression line (Fig.4).

Fig3. Relationship between position error and time

Fig4. Es score as function of the slope of regression line
Picking work evaluation (Ep)
Ep
is Comparative evaluation with true position. This is an index to evaluate likelihood of picking work. Evaluate whether the picking operation at the true position (decimated WMS) can be guessed or not (Fig.5). Each picking operation is done within a minimum of 3 seconds from the update time of the true position. In the case of picking work, the workers rarely walk.
Evaluation method :The score is calculated from the number of times you can check walking stop (tolerance 1 [m]) for 3 seconds at the true position (Fig.6). Refer to (1) for derivation formula.

Fig5. Picking operation example in true position

Fig6. Pi score as function of the movement distance for 3 seconds

Pi: Number of times picking determination was made*. Pmax : Number of all true positions.
*Count when walking stop (tolerance 1[m]) for 3 seconds is confirmed at the true
Human moving velocity evaluation (Ev)
Evaluation method: The velocity is calculated based on the distance and time between each estimated position. The score calculates the corresponding number of times from within the estimated trajectory with the moving velocity of the human being less than 1.5 [m / s] (Fig.8). Refer to (2) for derivation formula.

Fig7. Relationship between movement velocity and walking velocity threshold

Fig.8 vi score as function of the moving velocity

vi: Number of times that it is determined to be a human moving velocity*.vmax: Number between all trajectory positions.
*Count when moving velocity is less than 1.5[m/s].
Obstacle interference evaluation (Eo)
Evaluation method: The score is calculated according to the interference distance with the obstacle by linearly interpolating the estimated position (Fig.10). The allowable error of obstacle interference is 0.17 [m]. Refer to (3) for derivation formula.

Fig9. Relationship between obstacle and estimated trajectory

Fig10. oi score as function of the interference with obstacle

*Obstacle interference to lerance up to 0.17[m].
Update frequency evaluation (Ef)
Evaluation method: The score is calculated from the time difference from the estimated position to the update of the next estimated position (Fig.11). It is desirable that the update frequency is 1 [Hz] or more. Trajectory update frequency uses the equation (4). Refer to (5) for derivation formula.

ut : Update trajectory of t seconds. ut-1: Update trajectory of t-1 seconds.

Fig11. fi score as function of the trajectory update frequency

Comprehensive evaluation (C.E.)

Fig12. Percentage of each evaluation index in comprehensive evaluation
Important Dates
- Open request for admission to competition
(real-admission, required to send technical description)
- From Feb.6th,2017(Mon) to July 15th,2017(Sat)
- Notification of admission
- Shortly after requested by e-mail
- Submission of competitor's result
- Before Sep.8th,2017(Fri)
- Submission of paper (option)
-
30 July 2017, AoE
Contact points and information
You can check change logs on this page.
・Masakatsu Kourogi (m.kourogi@aist.go.jp), AIST, Tsukuba Japan
・Ryosuke Ichikari (r.ichikari@aist.go.jp), AIST, Tsukuba Japan

